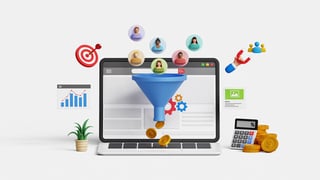
Data-Driven Decisions: How Reports and Dashboards are Transforming Banking

In the age of big data, banks and credit unions are swimming in information. Every transaction, customer interaction, and marketing campaign generates valuable data that can be harnessed to improve performance, enhance customer experiences, and drive strategic decision-making. But how can financial institutions effectively utilize this data to gain actionable insights? The answer lies in robust reporting and dashboard capabilities.
This article explores the power of reports and dashboards in the banking industry, highlighting how these tools can transform raw data into meaningful intelligence, leading to better outcomes for both institutions and their customers.
The Importance of Data Analytics in Banking
Data analytics plays a crucial role in modern banking, enabling institutions to:
-
Understand Customer Behavior: Analyze customer data to identify trends, preferences, and needs, leading to personalized services and targeted marketing campaigns.
- Measure Performance: Track key performance indicators (KPIs) like customer acquisition cost, customer lifetime value, and product profitability to assess the effectiveness of strategies and identify areas for improvement.
- Manage Risk: Analyze data and report on risks, such as fraud or credit defaults, allowing for proactive mitigation strategies.
- Optimize Operations: Streamline internal processes, improve efficiency, and reduce costs by analyzing operational data.
- Enhance Customer Experience: Gather customer feedback and analyze interaction data to identify pain points and improve the overall customer experience.
The Power of Reports and Dashboards
Reports and dashboards are essential tools for visualizing and analyzing data in a meaningful way. They provide a clear and concise overview of key metrics, trends, and insights, empowering decision-makers to take action.
Key Features of Effective Banking Reports and Dashboards:
- Customization: Tailor reports and dashboards to specific needs and roles, displaying the most relevant information for each user.
- Real-time Data: Access up-to-the-minute data to monitor performance and identify trends as they happen.
- Visualizations: Use charts, graphs, and other visual elements to make data more accessible and understandable.
- Drill-Down Capabilities: Dive deeper into specific data points to uncover underlying causes and gain detailed insights.
- Data Integration: Integrate data from various sources, such as core banking systems, LOS systems, CRM platforms, and marketing automation tools, to create a comprehensive view.
Examples of Reports and Dashboards in Banking
- Customer Relationship Management (CRM) Dashboards: Track customer interactions, engagement, and lifetime value.
- Marketing Dashboards: Monitor campaign performance, lead generation, and customer acquisition costs.
- Sales Dashboards: Track sales performance, pipeline activity, and conversion rates.
- Financial Performance Reports: Analyze profitability, revenue, and expenses.
- Risk Management Reports: Monitor credit risk and fraud detection.
- Customer Journey Analytics: Visualize the customer journey across various touchpoints to identify areas for improvement.
Benefits of Using Reports and Dashboards
- Improved Decision-Making: Gain data-driven insights to make informed strategic decisions.
- Enhanced Efficiency: Quickly identify trends and areas for improvement, leading to optimized processes and resource allocation.
- Increased Transparency: Provide a clear and accessible view of performance across the organization.
- Better Communication: Facilitate data-driven conversations and collaboration among teams.
- Enhanced Customer Experience: Use data to understand customer needs and preferences, leading to more personalized service.
Choosing the Right Tools
Many CRM and marketing automation platforms offer built-in reporting and dashboard capabilities. When selecting a solution for your financial institution, consider factors such as:
- Customization options: Can you tailor reports and dashboards to your specific needs?
- Data visualization capabilities: Does the platform offer a variety of charts and graphs to present data effectively?
- Integration with existing systems: Can the platform integrate with your core banking system and other data sources?
- Ease of use: Is the platform user-friendly and accessible to all relevant stakeholders?
Conclusion
In the financial services industry, and for banks and credit unions specifically, reports and dashboards are essential tools for turning raw data into actionable insights. By leveraging these tools effectively, financial institutions can gain a deeper understanding of their customers, optimize their operations, and make strategic decisions that drive growth and success.
Want to unlock the power of data analytics for your financial institution?
360 View offers customizable dashboards that allow you to highlight key metrics and data points that are relevant to your team, providing quick access to actionable insights.
See our dashboards in action:
Want to see more of what 360 View can do for your institution? Request a live demo and you'll get a one-on-one tour of our solution tailored to your specific needs.
